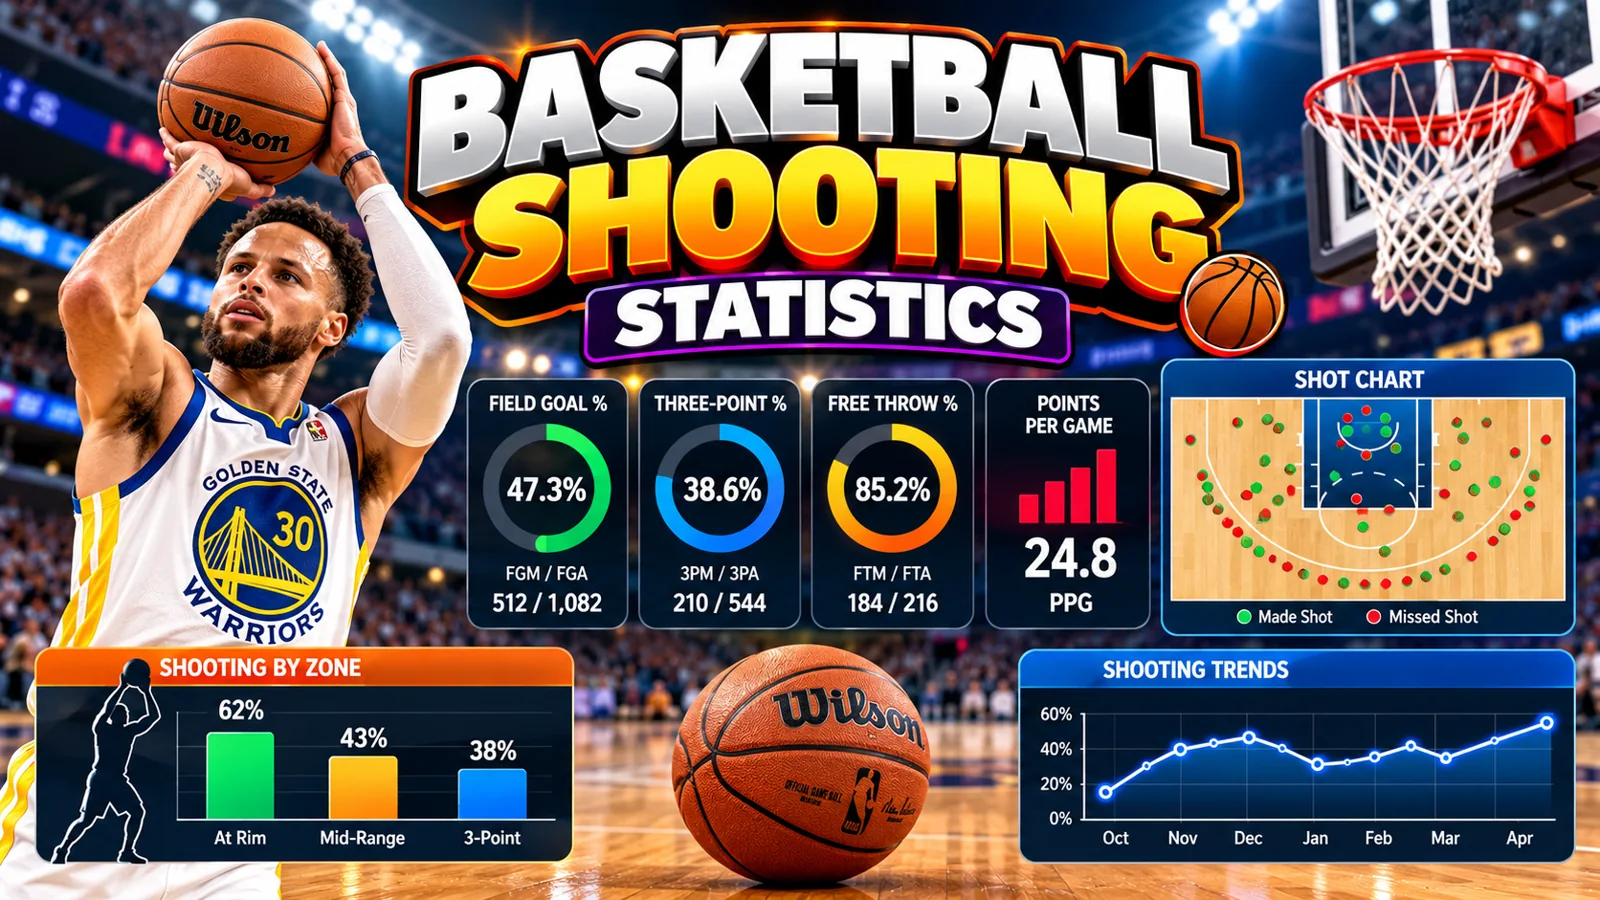
Shooting percentages explain made shots relative to attempts, but different metrics capture different parts of scoring. Learn the formulas and when not to compare them.
FG% = FGM ÷ FGA × 100; 3P% = 3PM ÷ 3PA × 100; eFG% = (FGM + 0.5 × 3PM) ÷ FGA × 100.
Use the matching Sports4u calculator to check the arithmetic; verify competition-specific rules with the organizer.
Field goal percentage in plain English
FG% is made field goals divided by attempted field goals. It includes two-point and three-point shots but normally excludes free throws. A player making seven of fifteen shots has a field-goal percentage of 46.7. The number indicates frequency of makes, but it does not tell you how many of those makes were worth three points. It also does not account for shot difficulty, spacing or opposing defenders.
Practical check: write down the input values and units first, then verify the operation independently. Interpret the result against the relevant match, workout or competition conditions instead of using the number without context.
Three-point and free-throw percentages
Three-point percentage isolates shots from beyond the arc: 3PM/3PA multiplied by 100. Free-throw percentage is FTM/FTA multiplied by 100. If a player makes four of ten threes, the three-point percentage is 40%; if they make seven of eight free throws, the free-throw percentage is 87.5%. These are separate categories. Do not add makes or attempts together and label the result FG% unless the statistic explicitly calls for that combination.
Practical check: write down the input values and units first, then verify the operation independently. Interpret the result against the relevant match, workout or competition conditions instead of using the number without context.
Effective field goal percentage
Effective field-goal percentage gives three-point makes an extra half-make of weight because they score three instead of two points. The formula is (FGM + 0.5 × 3PM) / FGA × 100. A player with eight field goals on twenty shots, four of which are threes, has an eFG% of (8+2)/20 = 50%. Their ordinary FG% is only 40%. This explains why comparing FG% alone can undervalue certain efficient outside shooters.
Practical check: write down the input values and units first, then verify the operation independently. Interpret the result against the relevant match, workout or competition conditions instead of using the number without context.
True shooting percentage is different
True shooting percentage attempts to summarize scoring efficiency across field goals and free throws using points scored and an estimated shooting possession denominator. A common approximation is points divided by twice (field goal attempts plus 0.44 times free-throw attempts). The 0.44 factor is an approximation and some data providers use more detailed possession tracking. The statistic therefore answers a broader question than FG% or eFG%, and implementations may not be directly interchangeable.
Practical check: write down the input values and units first, then verify the operation independently. Interpret the result against the relevant match, workout or competition conditions instead of using the number without context.
Small samples can deceive
A player who makes two of three shots posts 66.7% for that game, but three attempts are too few to establish a dependable shooting level. On twenty attempts, a single make changes FG% by five percentage points. On two hundred attempts, it changes the rate by half a percentage point. When judging performance, report the attempt count alongside the percentage. Season-long splits may be more meaningful than a single hot or cold night.
Practical check: write down the input values and units first, then verify the operation independently. Interpret the result against the relevant match, workout or competition conditions instead of using the number without context.
Shot selection and role matter
A center taking mostly close-range shots might have a much higher FG% than a guard taking difficult threes and late-clock jumpers. That gap alone does not prove who helped the offense more. Spacing, assists, turnovers, drawing fouls and overall offensive responsibility provide context. Compare players with similar roles when possible, and prefer a combination of percentages, volume and scoring impact over declaring a winner from one leaderboard.
Practical check: write down the input values and units first, then verify the operation independently. Interpret the result against the relevant match, workout or competition conditions instead of using the number without context.
How to check data accuracy
Confirm field-goal attempts include two- and three-point attempts, while free throws remain separate. Three-point makes cannot exceed field goals made; three-point attempts cannot exceed total field-goal attempts. All makes must be no greater than their respective attempts. Percentages with zero attempts are usually shown as unavailable rather than zero, because no rate can be computed without a denominator. These simple validations prevent many misleading player comparisons.
Practical check: write down the input values and units first, then verify the operation independently. Interpret the result against the relevant match, workout or competition conditions instead of using the number without context.
Use statistics constructively
Coaches can track shot location, attempt volume and game context to identify useful practice priorities. Fans can compare season trends, but should avoid treating a one-game percentage as a definitive statement about ability. When presenting performance online, show the data source and date and explain the metric. Use the calculator to verify simple arithmetic, then use real play observations to add insight that the statistic cannot supply.
Practical check: write down the input values and units first, then verify the operation independently. Interpret the result against the relevant match, workout or competition conditions instead of using the number without context.
Worked examples and situations to practice
These are hypothetical practice figures, not live scores or real athlete records. They are designed to make the calculations auditable and help you recognize common input errors.
Balanced shooter
Result: 40.0% field-goal percentage.
Eight made shots on twenty attempts is 40% FG.
Try this: Recalculate the result from the raw figures. Decide which additional context, such as competition rules, attempts, wickets or playing conditions, you would need before drawing a conclusion.
Hot shooting
Result: 60.0% field-goal percentage.
Twelve made shots on twenty attempts is 60% FG.
Try this: Recalculate the result from the raw figures. Decide which additional context, such as competition rules, attempts, wickets or playing conditions, you would need before drawing a conclusion.
Low volume
Result: 50.0% field-goal percentage.
Two makes on four attempts is 50% but uses a tiny sample.
Try this: Recalculate the result from the raw figures. Decide which additional context, such as competition rules, attempts, wickets or playing conditions, you would need before drawing a conclusion.
Bench role
Result: 33.3% field-goal percentage.
Three made shots on nine attempts is 33.3%.
Try this: Recalculate the result from the raw figures. Decide which additional context, such as competition rules, attempts, wickets or playing conditions, you would need before drawing a conclusion.
High usage
Result: 50.0% field-goal percentage.
Fifteen makes on thirty attempts is 50%.
Try this: Recalculate the result from the raw figures. Decide which additional context, such as competition rules, attempts, wickets or playing conditions, you would need before drawing a conclusion.
Cold night
Result: 10.0% field-goal percentage.
One made shot in ten attempts is 10%.
Try this: Recalculate the result from the raw figures. Decide which additional context, such as competition rules, attempts, wickets or playing conditions, you would need before drawing a conclusion.
Efficient start
Result: 83.3% field-goal percentage.
Five makes on six attempts is about 83.3%.
Try this: Recalculate the result from the raw figures. Decide which additional context, such as competition rules, attempts, wickets or playing conditions, you would need before drawing a conclusion.
Season stretch
Result: 42.0% field-goal percentage.
Forty-two makes on one hundred attempts is 42%.
Try this: Recalculate the result from the raw figures. Decide which additional context, such as competition rules, attempts, wickets or playing conditions, you would need before drawing a conclusion.
Key terms and definitions
- FGM/FGA
- Field goals made divided by field goals attempted.
- 3PM/3PA
- Three-point field goals made divided by three-point attempts.
- FTM/FTA
- Free throws made divided by free throw attempts.
- eFG%
- Effective field-goal percentage, which weights three-pointers more heavily.
Step-by-step accuracy checklist
- Identify the exact question you need answered before selecting a statistic or calculator.
- Write down the original data and its source; do not begin with a rounded display figure.
- Check units, decimal notation, and whether an exception changes the denominator.
- Apply the published formula and retain enough precision for verification.
- Compare the result with an independently worked example or trusted official data.
- Label estimates and provisional calculations clearly; include competition context when applicable.
- Document the date and specific version of any competition rule used.
- Use the result to answer the original question rather than making broad claims the number cannot support.
Tools you can use next
For faster calculations, these browser-based tools can help you check sample numbers and experiment with your own inputs. They do not replace official match records, medical advice or an event organizer’s rulebook.
Frequently asked questions
Are free throws included in FG%?
No. Field-goal percentage and free-throw percentage are normally reported separately. When comparing results, keep the original measurements available and confirm any rules or assumptions that affect the calculation.
Why can eFG% be higher than FG%?
eFG% credits the additional point value of a three-pointer. When comparing results, keep the original measurements available and confirm any rules or assumptions that affect the calculation.
What happens with zero attempts?
The percentage is undefined; use N/A instead of reporting a misleading 0%. When comparing results, keep the original measurements available and confirm any rules or assumptions that affect the calculation.
Is the highest FG% always the best shooter?
No. Shot type, volume, role and difficulty are important context. When comparing results, keep the original measurements available and confirm any rules or assumptions that affect the calculation.
Editorial note: This educational guide uses hypothetical worked examples and transparent arithmetic. Sports4u does not claim that calculations represent official competition statistics. Always check the relevant governing body or organizer for event-specific rules.